Picture Graphs
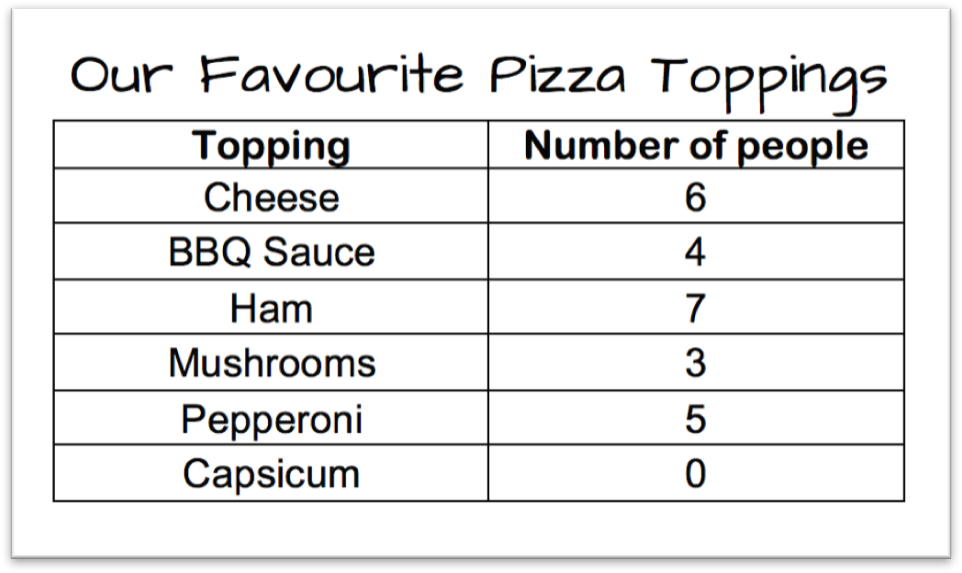
Picture graphs are a useful way to present data about a topic. Children in a class were surveyed about their favourite pizza toppings. The data from the survey is in the table below. Today we will create a picture graph using this data and the tools in Explain Everything.
Making a Graph


|


|


|


|


|


|